
Blog flowers, blog graphs
This an applet that turns your blog into a graph. The following images are visualizations of 2 of my blogs. Click on the links to watch how the graphs form. It's interesting to observe how the blogs have grown and changed over the past 37 months.
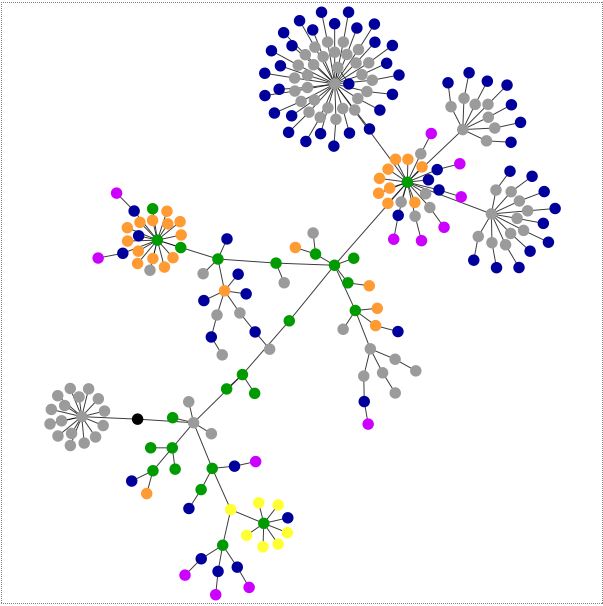
Legend
black: the HTML tag, the root node
blue: for links (the A tag)
red: for tables (TABLE, TR and TD tags)
green: for the DIV tag
violet: for images (the IMG tag)
yellow: for forms (FORM, INPUT, TEXTAREA, SELECT and OPTION tags)
orange: for linebreaks and blockquotes (BR, P, and BLOCKQUOTE tags)
gray: all other tags
Sandbox in September 28, 2006.

Sandbox in October 27, 2009.
See it in action.

Pedal Damn It in September 28, 2006.

Pedal Damn It in October 27, 2009.
See it in action.
To create a graph of your own blog, go here.
Made by Marcel Salathe (salathe.marcel AT gmail DOT com).
More about the creator of this HTML Graph Applet.
Sourcecode.
posted by -ben | 1:07 PM
![]()
![]()
0 Comments:
Post a Comment
<< Home